Explains how to use Excel predictive analytics to solve problems in areas ranging from sales and marketing to operations. Reveals how to build credible and reliable forecasts. Describes advanced techniques to build revenue, reduce costs and improve productivity. Includes downloadable Excel workbooks to adapt to your own requirements.
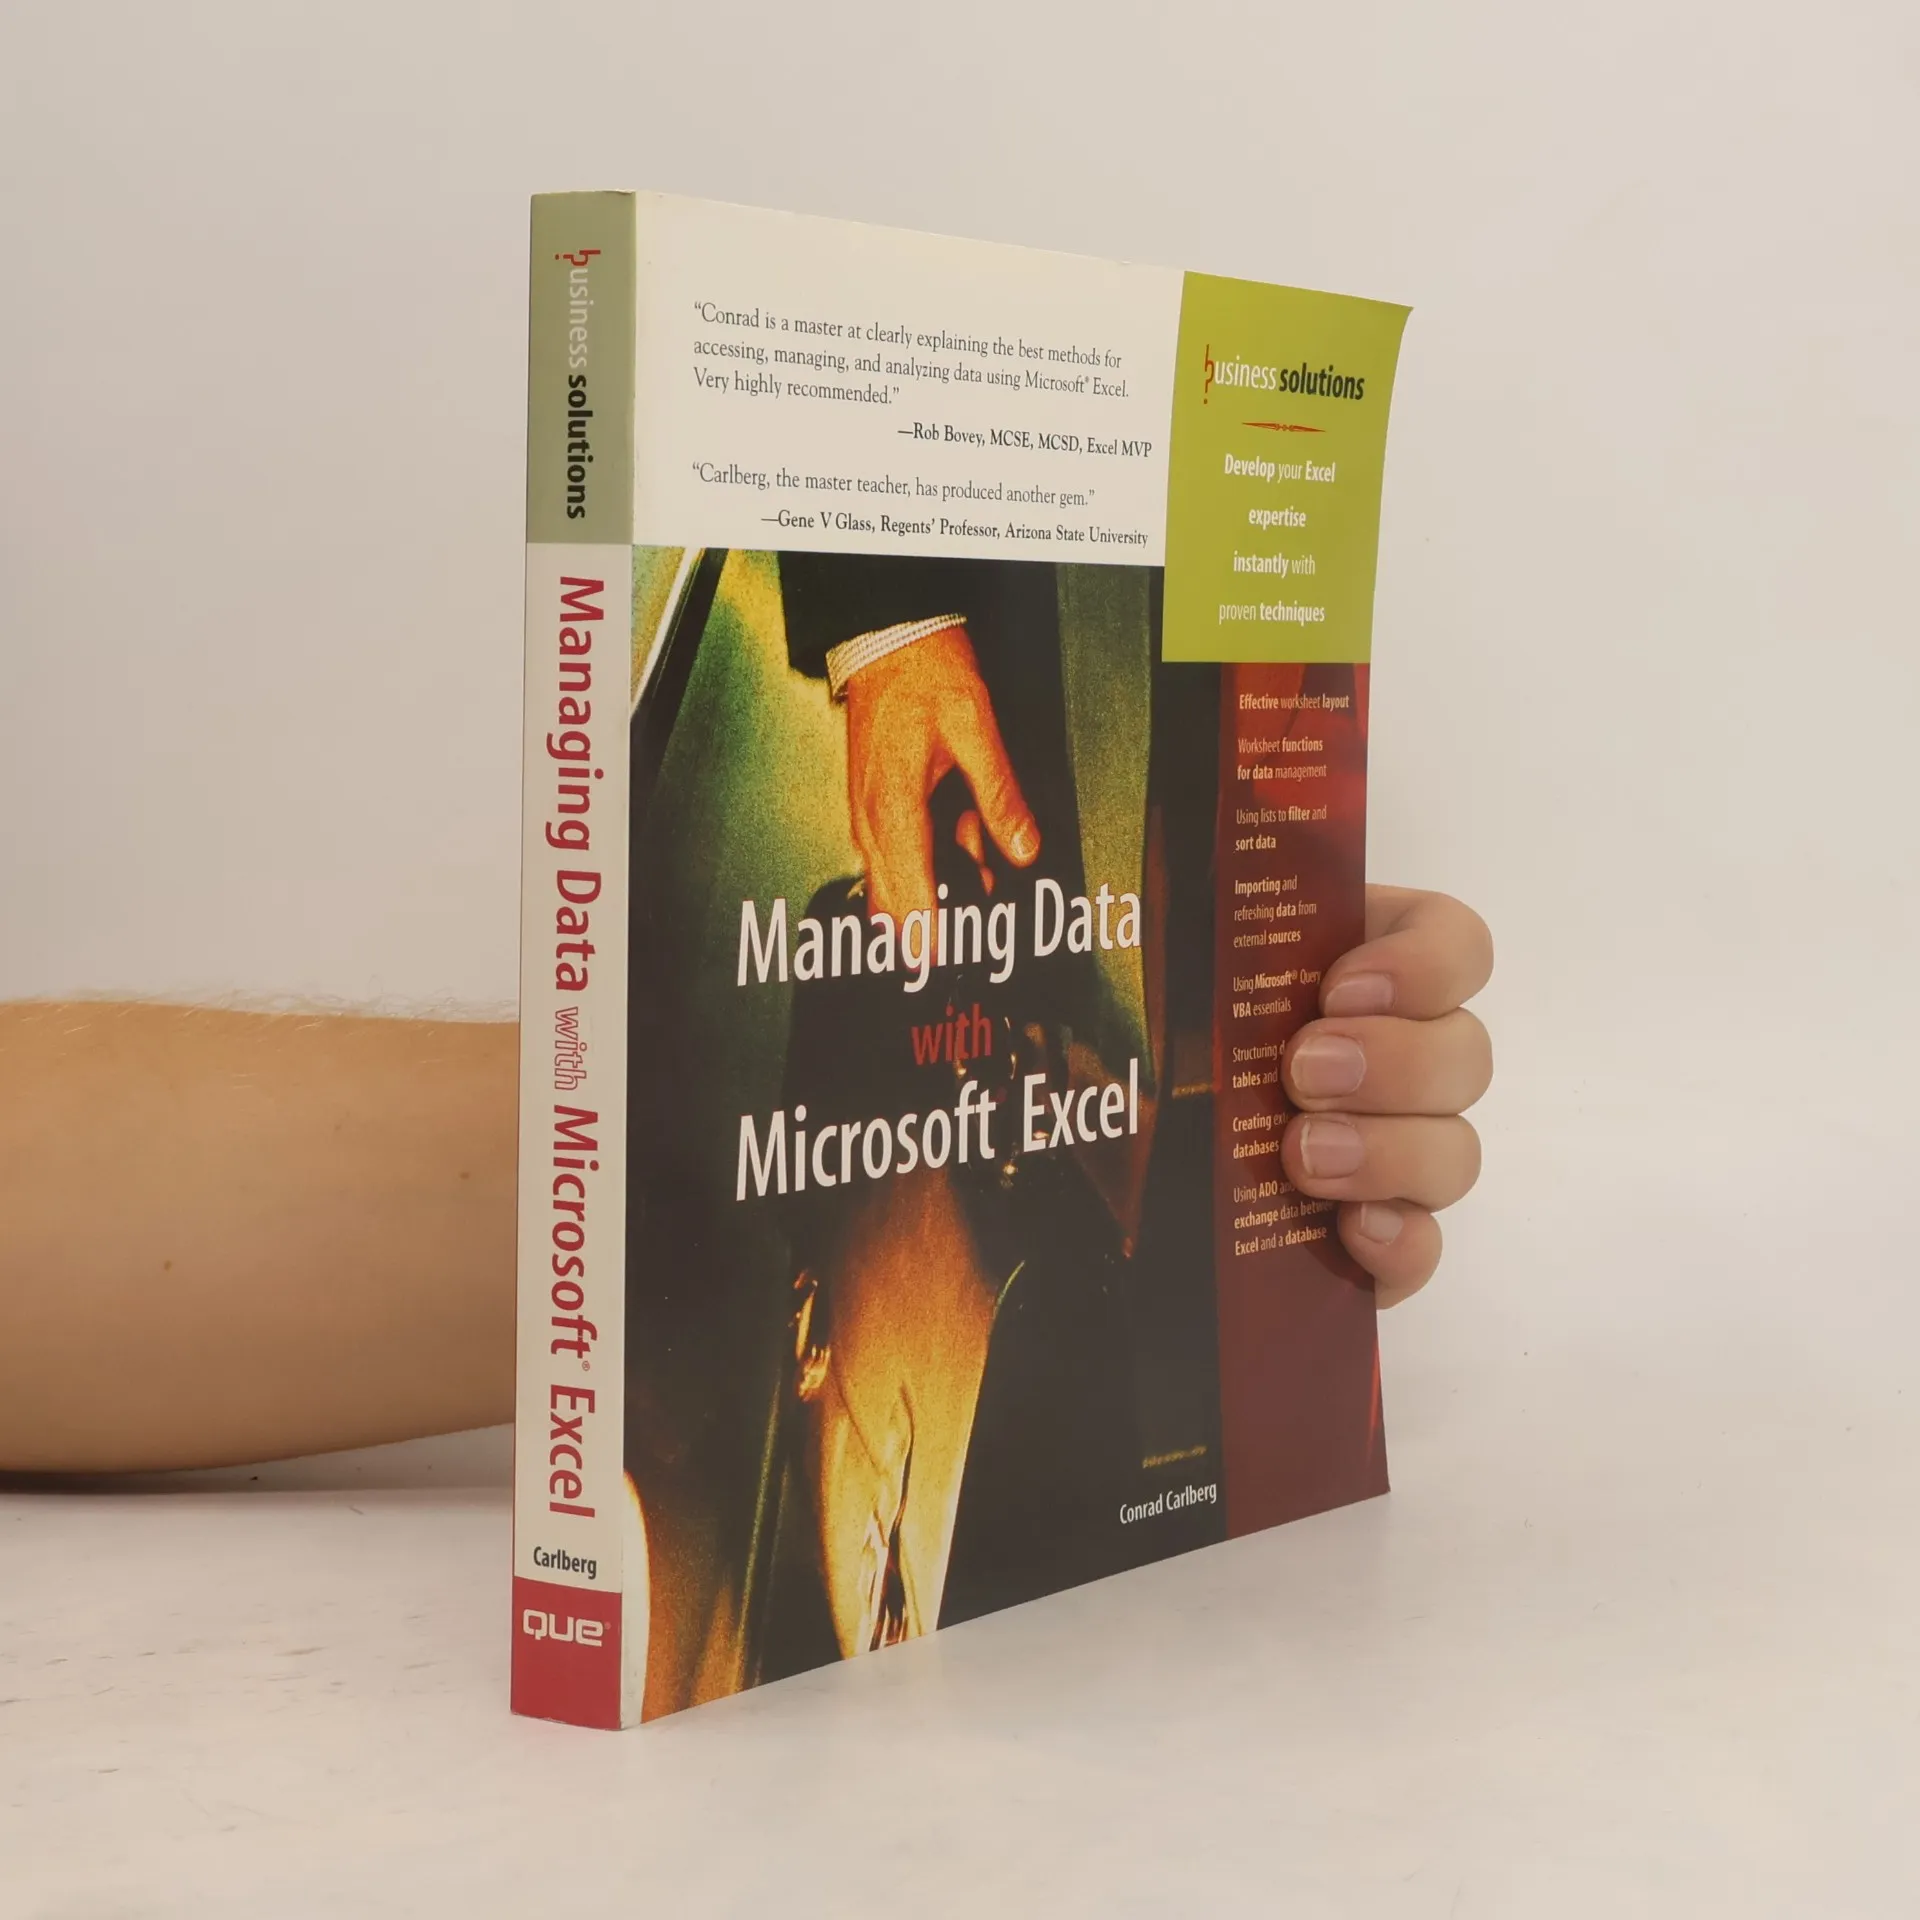
You have learned the methods to the madness of Excel. Formulas and functions are friends instead of foes. Yet you know there's something missing that could make your job even easier. That "something" is efficient and effective data management. Managing Data with Excel is the only book on the market that focuses on just that. Learn how to efficiently move data, automate data storage and import data into worksheets and pivot tables. Case studies are included in each chapter to illustrate real-world applications of these functions. Invest your time in learning this now so that you can stop wasting your time figuring out how to work around problems.
Statistical Microsoft Excel 2010 is an essential resource for anyone looking to leverage Excel for quantitative analysis. With Excel 2010’s robust statistical tools, users can transform data into actionable insights, enhancing their ability to make accurate inferences and solve problems across various fields, including business and health sciences. Expert Conrad Carlberg guides readers through core statistical tasks essential for professionals, students, and researchers, using real-world examples to illustrate the best techniques for each scenario.
The book covers crucial statistical concepts such as correlation, regression, and analysis of variance and covariance, alongside hypothesis testing using various distributions. Readers will learn to master descriptive and inferential statistical tools, summarize data effectively, and understand how to infer population characteristics from sample distributions.
With clear instructions and step-by-step projects, the book also introduces Excel’s new consistency functions and offers insights into testing differences between means using z tests, t tests, and ANOVA. Each chapter is accompanied by an Excel workbook, providing practical exercises and additional resources, including a chart illustrating the impact of sample size and other factors on statistical power. Access to these files is available online for further learning.