

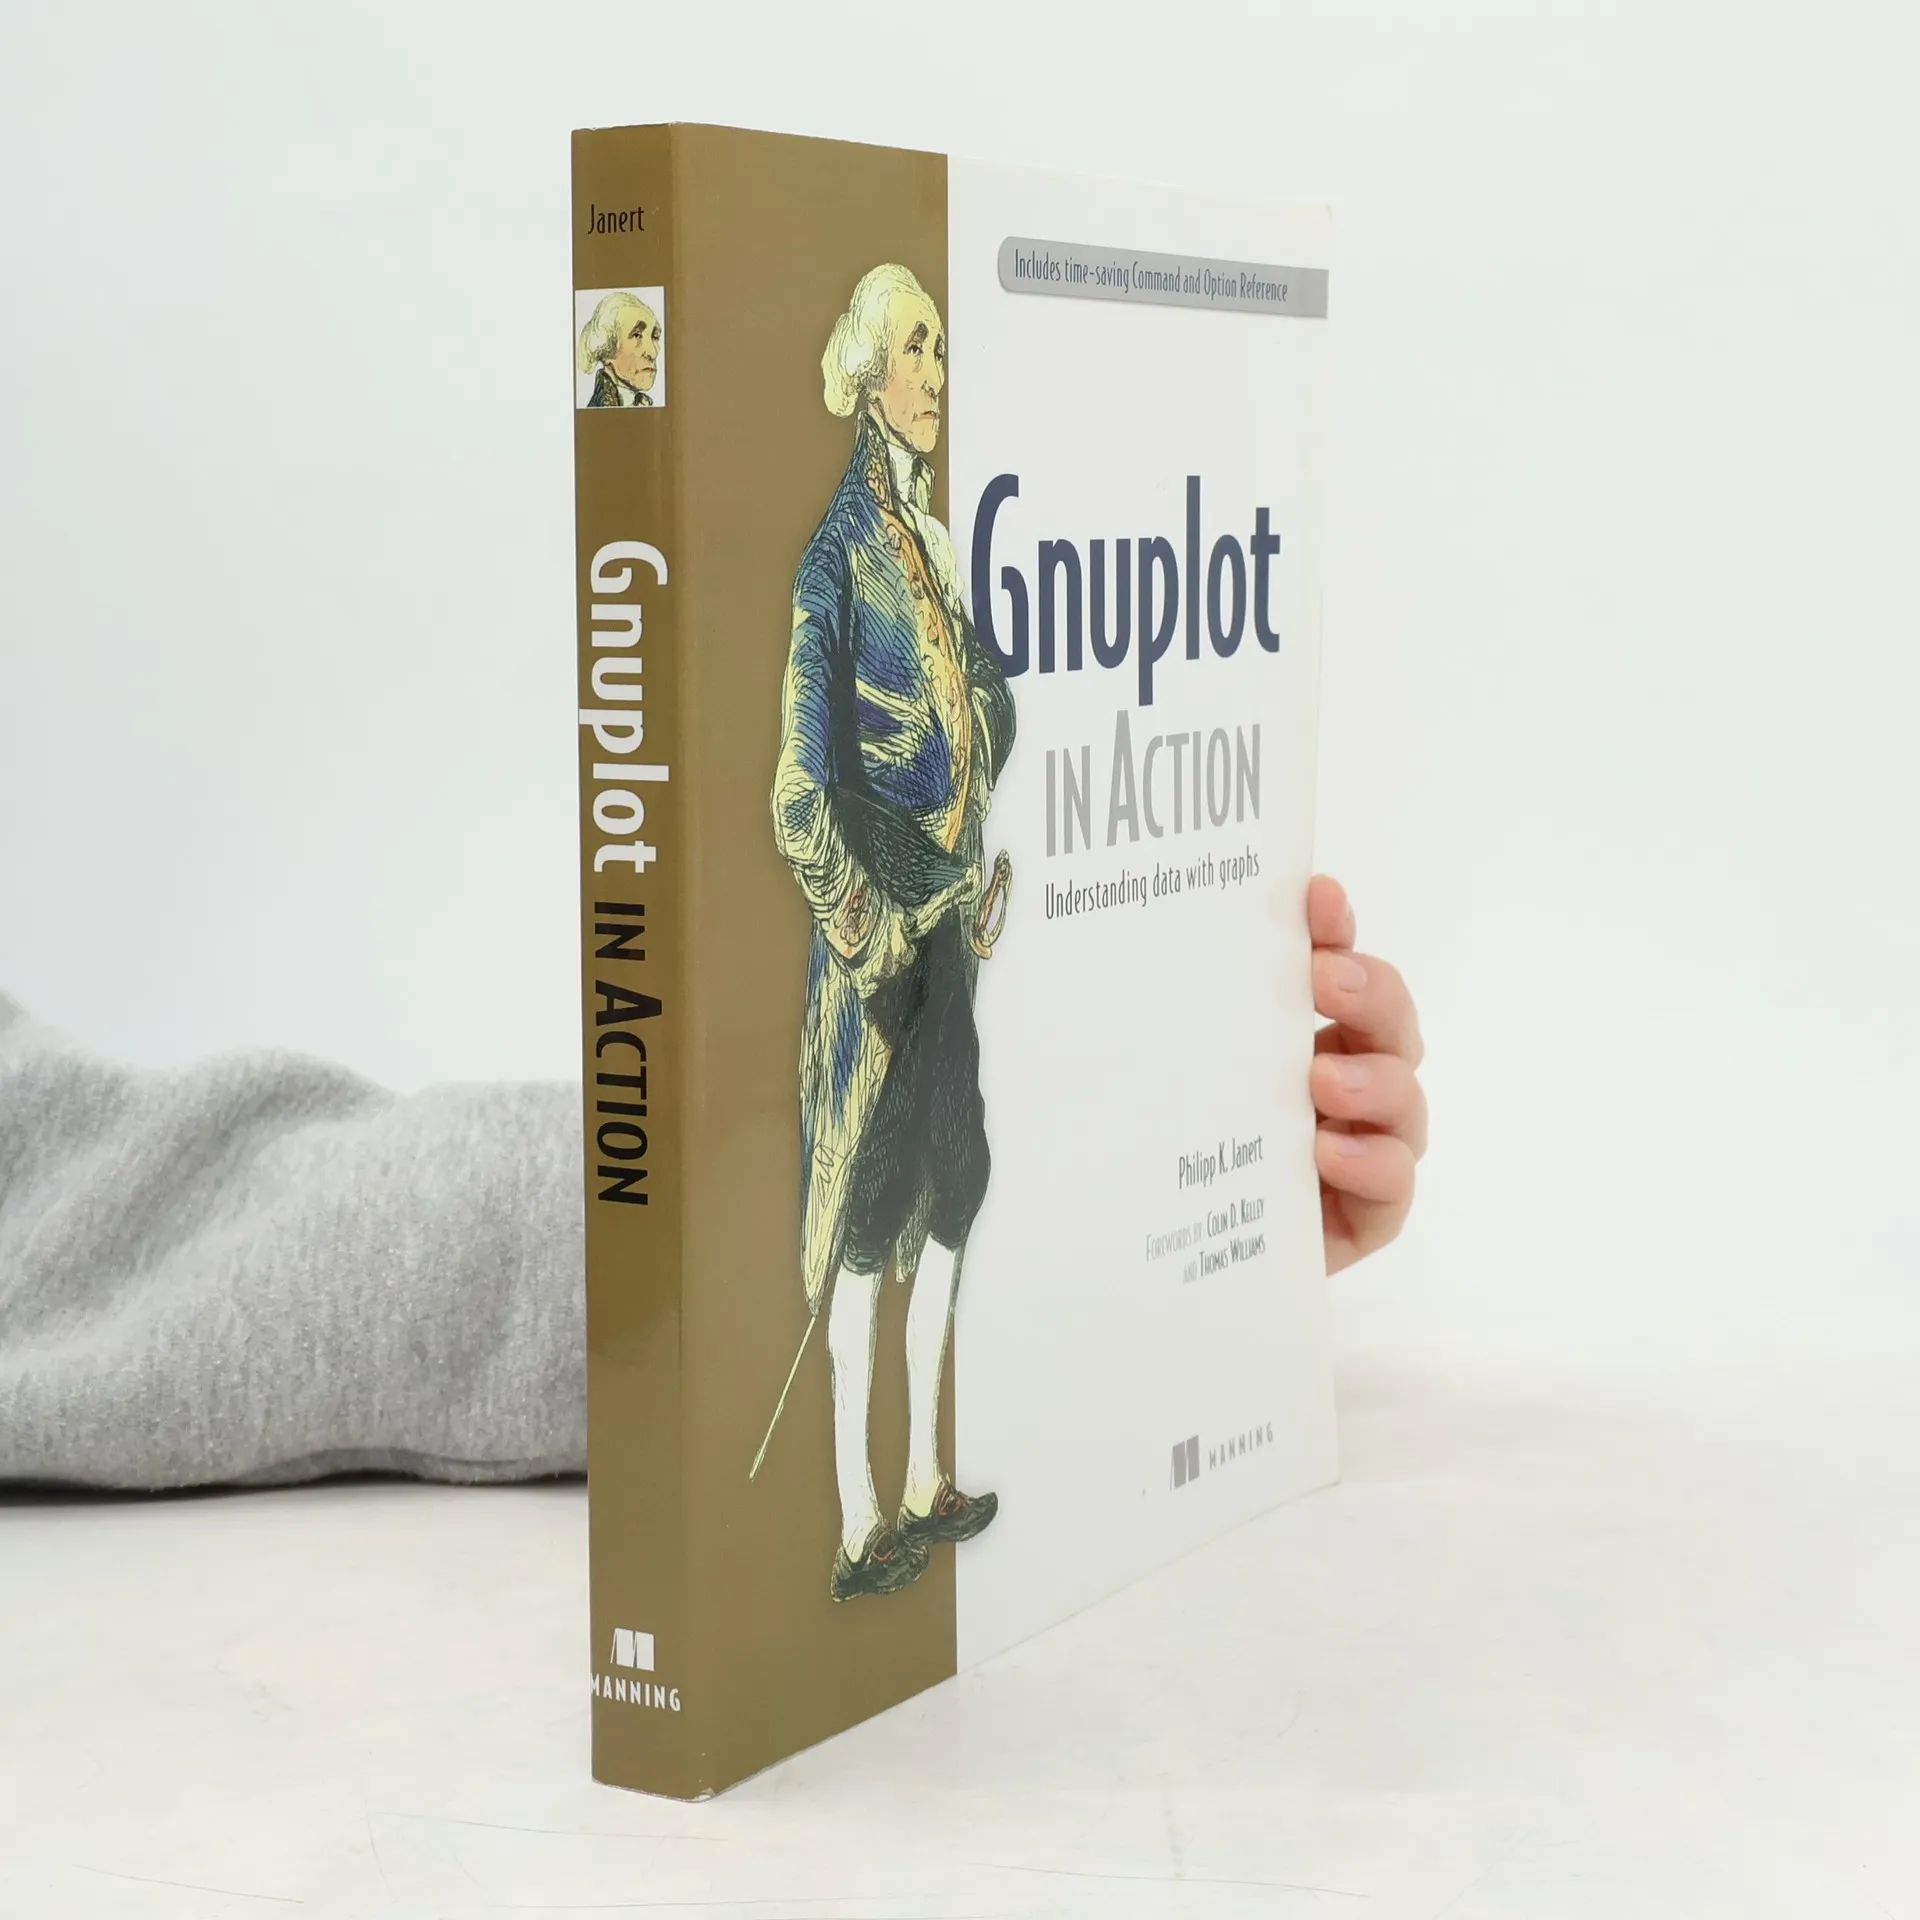
Statistical data is only as valuable as your ability to analyze, interpret, and present it effectively. Gnuplot is a widely used program for plotting and visualizing data across Unix/Linux, Windows, and Mac systems. As an open-source tool, it is free, actively maintained, and capable of handling large datasets while producing high-quality graphics suitable for publication. However, comprehensive documentation has been lacking, making it challenging for newcomers to grasp its full potential. This book serves as the first thorough introduction to gnuplot, covering everything from basic concepts to advanced features. It provides a tutorial on using gnuplot to extract insights from data, focusing on tricky areas that are often poorly explained. Readers will learn to generate various types of graphs and understand when to use them effectively. Notably, gnuplot requires no programming skills or advanced knowledge of mathematics or statistics, making it accessible for those without a background in data analysis. Beginning with fundamental concepts, the book guides readers through preparing graphs for presentation, including enhancements like arrows and labels. It also delves into advanced topics, such as multi-dimensional graphs and scripting gnuplot for batch jobs or dynamic website graphics. This resource is ideal for individuals in various fields, including DBAs, programmers, business analysts, and process engineers. Purchasi
Philipp K. Janert Boeken

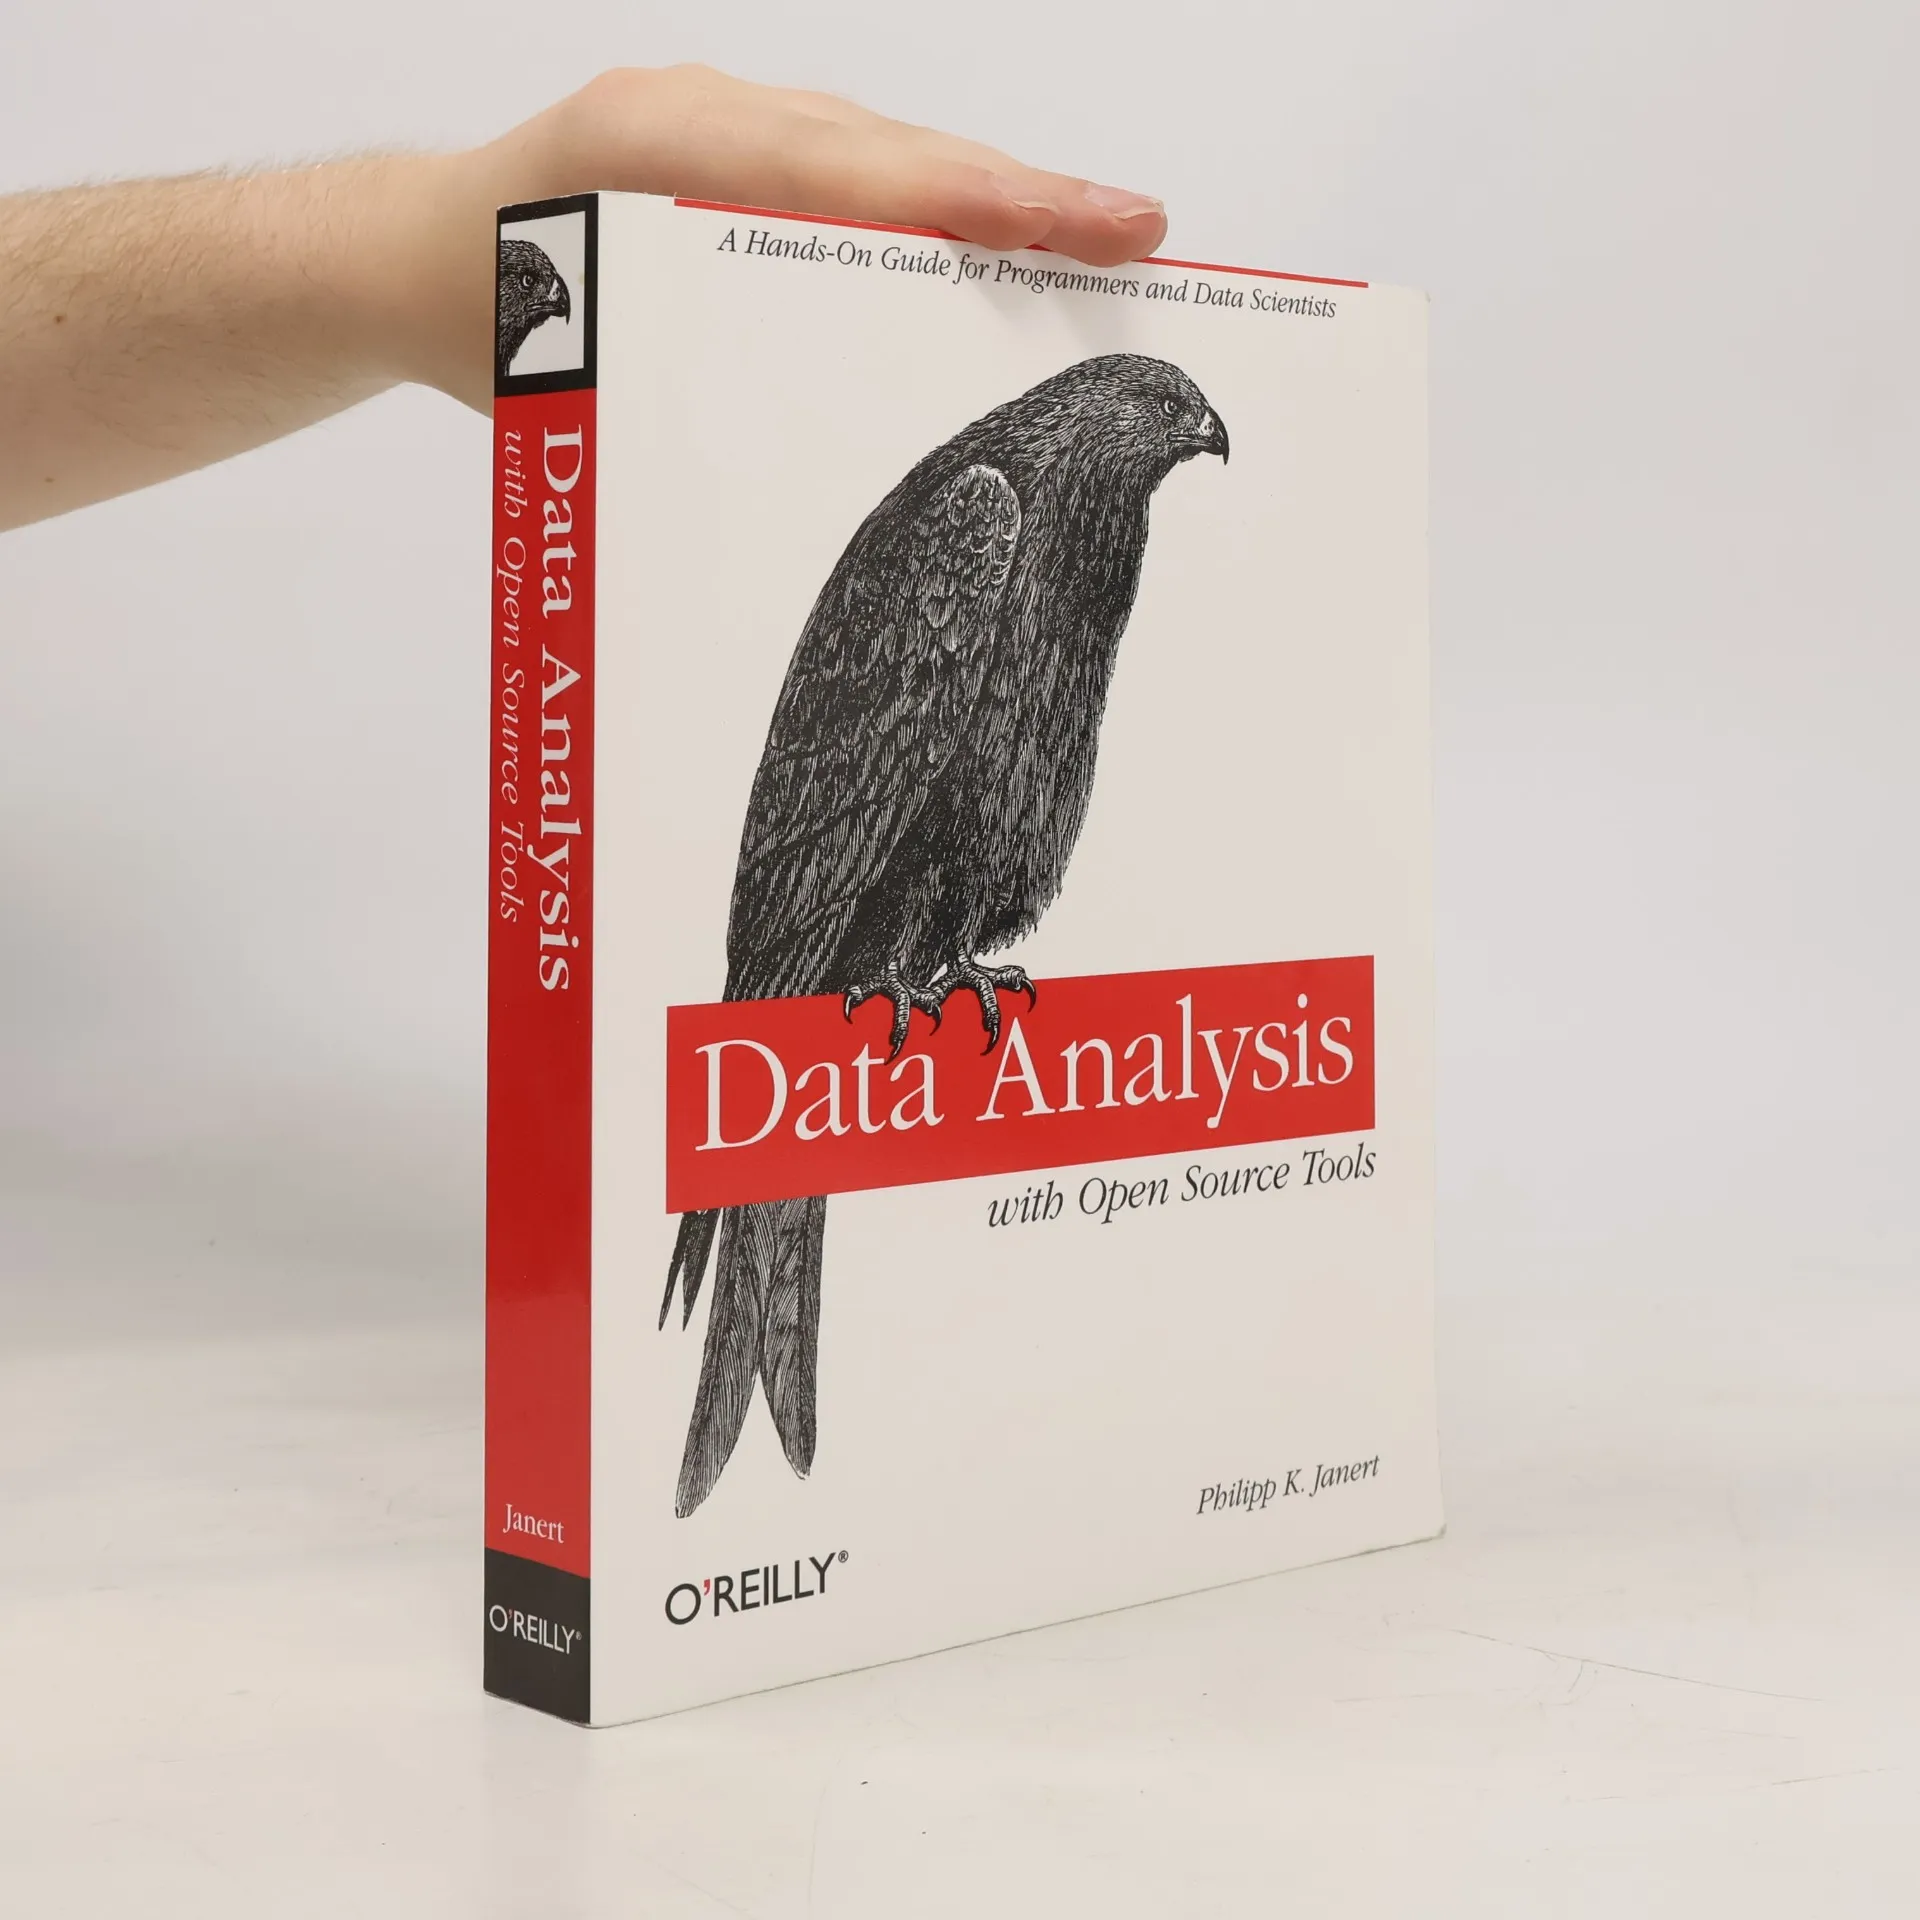
Data Analysis with Open Source Tools
A Hands-On Guide for Programmers and Data Scientists
- 530bladzijden
- 19 uur lezen
These days it seems like everyone is collecting data. But all of that data is just raw information -- to make that information meaningful, it has to be organized, filtered, and analyzed. Anyone can apply data analysis tools and get results, but without the right approach those results may be useless. Author Philipp Janert teaches you how to think about how to effectively approach data analysis problems, and how to extract all of the available information from your data. Janert covers univariate data, data in multiple dimensions, time series data, graphical techniques, data mining, machine learning, and many other topics. He also reveals how seat-of-the-pants knowledge can lead you to the best approach right from the start, and how to assess results to determine if they're meaningful.
Der Standard für JavaScript-GrafikenD3.js ist die führende JavaScript-Bibliothek für webbasierte Grafiken und Visualisierungen. Wenn Sie es eilig haben, D3.js zu lernen, ist dieses Buch genau das Richtige für Sie. Es ist kompakt gehalten und konzentriert sich auf Konzepte und Muster. Außerdem werden unterstützende Technologien wie SVG, HTML5, CSS und das DOM erklärt. Der Autor Philipp K. Janert zeigt Ihnen, wie Sie D3 auf Ihre eigenen Probleme anwenden können.